Description:
The interactive is labeled Gas Power Cycles. The first slide of the interactive has a “Start” button. On clicking the button, an interactive screen pops up, illustrating the working of the Ericsson cycle. The drop-down box placed at the upper-right corner of the screen allows one to navigate through the interactives for the different gas power cycles: the Otto cycle, the Carnot cycle, the Rankine cycle, the Diesel cycle, the Ericsson cycle, the Brayton cycle, and the Stirling cycle.
The screen is apportioned into different sections. The left side of the screen displays the cross sections of a compressor, a turbine and a regenerator. As shown in the figure, the dial used to navigate through the different stages of an Otto cycle is placed below this cross section. The dial moves from stages 1 to 2, 2 to 3, 3 to 4, and then finally 4 to 1.
 The area to the right of the cross section
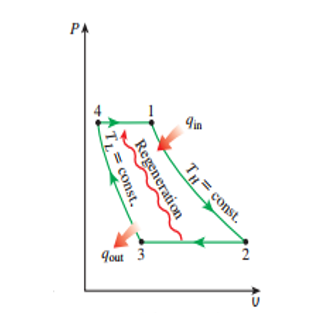
is split horizontally into two. The top portion shows two diagrams: the P V diagram and the T S diagram. The X-axis of the P V diagram indicates volume, and the Y-axis indicates pressure. The X-axis of the T S diagram indicates entropy, and
the Y-axis indicates temperature.
The area to the right of the cross section
is split horizontally into two. The top portion shows two diagrams: the P V diagram and the T S diagram. The X-axis of the P V diagram indicates volume, and the Y-axis indicates pressure. The X-axis of the T S diagram indicates entropy, and
the Y-axis indicates temperature.
The lower portion displays a written explanation of the process during each stage.
Description of the four stages in the Ericsson Cycle:
Stage 1 to 2:
In the initial stage, isothermal expansion of fluid takes place. In this process, the fluid from the regenerator enters the turbine. In the turbine, heat is added from an external heating source. Expansion of fluids occurs in the turbine. During this process, there is a decrease in pressure with an increase in volume as we move from point 1 to 2 in the P V diagram. Since this process occurs as isothermal condition the temperature of the fluid remains constant while entropy increases from point 1 to 2 as shown in T S diagram.
Stage 2 to 3:
Isobaric heat rejection: In this process, the fluid coming out of the turbine enters the regenerator. This process is also known as the constant regeneration process. During this process, the heat from process 2-3 can be transferred to process 4-1. In the P V diagram, as we move from point 2 to 3, the volume of the fluid increases, while the pressure remains constant. And as seen in the T S diagram, from point 2 to 3, the temperature decreases with a decrease in entropy.
Stage 3 to 4:
Isothermal compression: During this step, the fluid enters the compressor, where it is compressed. As we move from point 3 to 4, the volume of the fluid reduces, while the pressure increases, as shown in the P V diagram. As this is an isothermal process, the temperature remains constant, while the entropy of the fluid decreases, as shown in the T S diagram.
Stage 4 to 1:
Isobaric heat absorption: This is the last stage of the cycle, where the compressed fluid, which is at a high pressure, enters the regenerator. During this process, work is done by the system. The regenerator absorbs the previously stored heat.As we move from point 4 to 1, the temperature remains constant, while the volume of the fluid increases, as shown in the P V diagram. Also, as shown in the T S diagram, temperature increases with increase in entropy as we move from point 4 to 1.