Description:
The interactive is labeled Gas Power Cycles. The first slide of the interactive has a “Start” button. On clicking the button, the interactive screen pops up, illustrating the working of the Otto cycle. The drop-down box placed at the upper right corner of the screen allows one to navigate through the interactives for the different gas power cycles: the Otto cycle, the Carnot cycle, the Rankine cycle, the diesel cycle, the Ericson cycle, the Brayton cycle, and the Stirling cycle.
The screen is apportioned into different sections. The left side of the screen displays the cross section of a single-cylinder spark-ignition engine. This engine has a cylindrical interior with a hemispherical bottom. The crankshaft is placed in the middle of the hemisphere and is connected to the piston using a connecting rod or a rocker. The engine also has an intake valve on the upper¬-left corner and an exhaust valve on the upper-right corner. The dial used to navigate through different stages of an Otto cycle is placed below this cross section. The dial moves from stages 0 to 1, 1 to 2, 2 to 3, 3 to 4, 4 to 1, and then finally, 1 to 0.
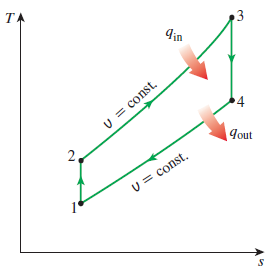
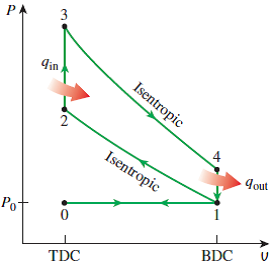 The area to the right of the cross section, is split horizontally into two. The top portion shows two diagrams: the P V diagram and the T S diagram. The X-axis of the P V diagram indicates volume, and the Y-axis indicates pressure. The X-axis of the T S diagram indicates entropy, and the Y-axis indicates temperature.
The lower portion displays a written explanation of the process during each stage.
Description of stages in the Otto Cycle:
At the start of the cycle, the piston is at its highest position called the top dead center (T D C). The area above the piston is minimum at this point. This point is denoted as point 0 in the P V diagram.
Stage 0 to 1:
The first step of the cycle is the intake stroke. The crankshaft rotates and the resulting movement of the connecting rod causes the piston to move to the bottom dead center (B D C) position. This movement opens the intake valve and draws in a mixture of air and fuel. This process is a constant entropy in the T S diagram, so the abscissa of the T S diagram remains constant. In the P V diagram, the dot goes from point 0 to point 1.
Stage 1 to 2:
In the compression stroke—which is the second step in the cycle—the rotation of the crankshaft once again moves the piston towards the T D C position, thereby compressing the fuel at the top of the engine. The dots in both the cycles go from point 1 to point 2.
Stage 2 to 3:
Here, the piston reaches the T B D position. The temperature of the compressed air and fuel mixture crosses the ignition point, causing the spark plug to fire. The mixture ignites and increases the pressure and temperature inside the engine. The dots in both the graphs go from point 2 to point 3.
Stage 3 to 4:
Once the spark plug fires, the crankshaft moves the piston down in the power stroke, also called the expansion stroke. The high-pressure gases force the piston down, rotating the crankshaft, and producing a useful work output. The burning of the fuel inside the engine further increases the heat. The dots in both the P V and the T S diagrams move from point 3 to point 4.
Stage 4 to 1:
Toward the end of the expansion stroke, the exhaust valve opens and the combustion gases that are above the atmospheric pressure rush out of the cylinder through the open exhaust valve. This process is called exhaust blowdown, or heat rejection, and most combustion gases leave the cylinder by the time the piston reaches the B D C. The dots in both the diagrams go from point 4 to point 1.
Stage 1 to 0:
As the piston reaches the B D C position, the cylinder is filled with exhaust gases at a lower pressure. The piston moves up one more time to expel these gases through the exhaust valve, completing the exhaust stroke. The dots in the P V diagram moves from 1 to 0. There is no change in the T S diagram. The piston then moves down for the intake stroke, and the entire process is repeated again.