Description:
The interactive is labeled Gas Power Cycles. The first slide of the interactive has a “Start” button. On clicking the button, an interactive screen pops up, illustrating the working of the Rankine cycle. The drop-down box placed at the upper-right corner of the screen allows one to navigate through the interactives for the various gas power cycles: the Otto cycle, the Carnot cycle, the Rankine cycle, the Diesel cycle, the Ericsson cycle, the Brayton cycle, and the Stirling cycle.
The screen is apportioned into different sections. The left side of the screen displays the cross section of a Rankine cycle. The Rankine cycle consists of a boiler in which heat is supplied by an external medium. It also consists of a turbine in which expansion takes place. From the turbine, the fluid moves to the condenser in which the heat is given out to an external medium. Now, the fluid from the condenser is taken by a pump. During this process, work is done by the system. The dial used to navigate through the different stages of an Otto cycle is placed below this cross section. The dial moves from stages 1 to 2, 2 to 3, 3 to 4, and then finally 4 to 1.
 The area to the right of the cross section is split horizontally into two. The top portion shows two diagrams: the P V diagram and the T S diagram.
The X-axis of the P V diagram indicates volume, and the Y-axis indicates pressure. The X-axis of the T S diagram indicates entropy, and the Y-axis indicates temperature.
The area to the right of the cross section is split horizontally into two. The top portion shows two diagrams: the P V diagram and the T S diagram.
The X-axis of the P V diagram indicates volume, and the Y-axis indicates pressure. The X-axis of the T S diagram indicates entropy, and the Y-axis indicates temperature.
The lower portion displays a written explanation of the process during each stage.
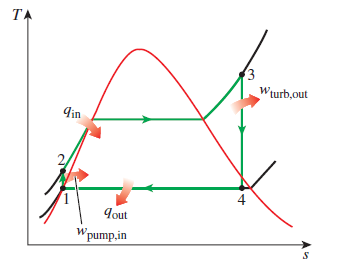
Description of the four stages in the Rankine cycle:
Stage 1 to 2:
The gas is compressed in the compressor, where its temperature and pressure are raised. The entropy remains unchanged. This stage is known as isentropic compression. The dots in both the graphs go from point 1 to point 2.
Stage 2 to 3:
Here, the high pressure gas proceeds into the high-temperature heat exchanger, where it undergoes a constant-pressure heat-addition process. The gas attains the maximum temperature that the turbine blades can withstand. The dots in both the graphs go from point 2 to point 3.
Stage 3 to 4:
Now, the compressed and heated gas expands in the turbine and produces power. In this process, both the temperature and the pressure decreases. The entropy remains unchanged. This stage is known as isentropic expansion. The dots in both the P V and the T S diagrams move from point 3 to point 4.
Stage 4 to 1:
In this stage, the gas leaves the turbine and enters the low-temperature heat exchanger, where the cycle completes by a constant-pressure heat-rejection process. The residual heat is rejected and the gas is cooled. The dots in both the diagrams go from point 4 to point 1.