Description:
The interactive is labeled Gas Power Cycles. The first slide of the interactive has a “Start” button. On clicking the button, an interactive screen pops up, illustrating the working of the Stirling cycle. The drop-down box placed at the upper-right corner of the screen allows one to navigate through the interactives for the various gas power cycles: the Otto cycle, the Carnot cycle, the Rankine cycle, the Diesel cycle, the Ericsson cycle, the Brayton cycle, and the Stirling cycle.
The screen is apportioned into different sections. The left side of the screen displays the cross section of a Stirling cycle. It consists of a rotating disk, which does the function of a flywheel. Above the rotating disk, there is an engine cylinder in which a displacer piston and a power piston are placed one below the other. When external heat is supplied with the help of a burner, there is expansion of gas when it is heated and compression of gas when cooled. This process makes the rotating disk move. The dial used to navigate through the different stages of an Otto cycle is placed below this cross section. The dial moves from stages 1 to 2, 2 to 3, 3 to 4, and then finally 4 to 1.

 The area to the right of the cross section
is split horizontally into two. The top portion shows two diagrams: the P V diagram and the T S diagram. The X-axis of the P V diagram indicates volume, and the Y-axis indicates pressure. The X-axis of the T S diagram indicates entropy, and
the Y-axis indicates temperature.
The area to the right of the cross section
is split horizontally into two. The top portion shows two diagrams: the P V diagram and the T S diagram. The X-axis of the P V diagram indicates volume, and the Y-axis indicates pressure. The X-axis of the T S diagram indicates entropy, and
the Y-axis indicates temperature.
The lower portion displays a written explanation of the process during each stage.
Description of stages in the Stirling Cycle:
Stage 1 to 2:
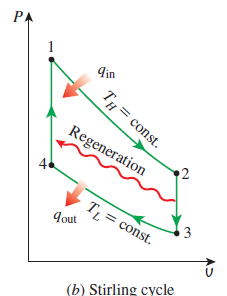
At the start of the cycle, heat is added with the help of an external source. As the heat is added, expansion of gas occurs as shown in figure the area which is colored in blue. During this process, the dots move from 1 to 2 in the P V diagram, the pressure of gas decreases with increase in volume. Also, as we can see in the T S diagram, the entropy of the gas increases, while the temperature remains constant.
Stage 2 to 3:
In the next step of the cycle, the hot air moves downward and gets cooler, while the cold air moves upward and gets heated. This is done by the displacer piston, which moves the air between both the ends. At this stage, constant regeneration occurs. During the constant regeneration process, the heat from the process 2-3 can be transferred to the process 4-1. As we can see in the P V and T S diagram, there is a curved arrow connected from step 2-3 to step 4-1
Stage 3 to 4:
Compression of gas occurs at this stage. In this process, the heat is rejected to the external source. During this process, the power piston adjusts the volume of the gas. As the piston moves, the energy gets transferred to the rotating disc and hence the disc rotates. During this process, the dots move from 3-4 in the T S and P V diagram. In this process, the volume decreases, while the pressure increases. In the T S diagram, entropy decreases at constant temperature.
Stage 4 to 1:
This is the last step of the cycle, and constant regeneration occurs in this stage. In this process, the energy from the rotating disk goes back to the piston, and the process repeats. During this process, the dots move from point 3 to 4, as shown in the P V and T S diagram.In this process, the pressure increases, while the volume remains constant. Also, the temperature increases with an increase in entropy.